Analytics & Dashboards
Real-time visibility into your facility's performance. KPIs, trends, and actionable insights at a glance.
KPI Dashboard
Key performance indicators updated in real-time. Occupancy rate, revenue, collections, and more on one screen.
Trend Analysis
Visualize performance over time. Spot patterns, seasonal trends, and areas needing attention.
Multi-Location Comparison
Compare performance across all your facilities. Identify top performers and opportunities.
Enterprise TierAutomated Alerts
Get notified when metrics fall outside expected ranges. Never miss an important change.
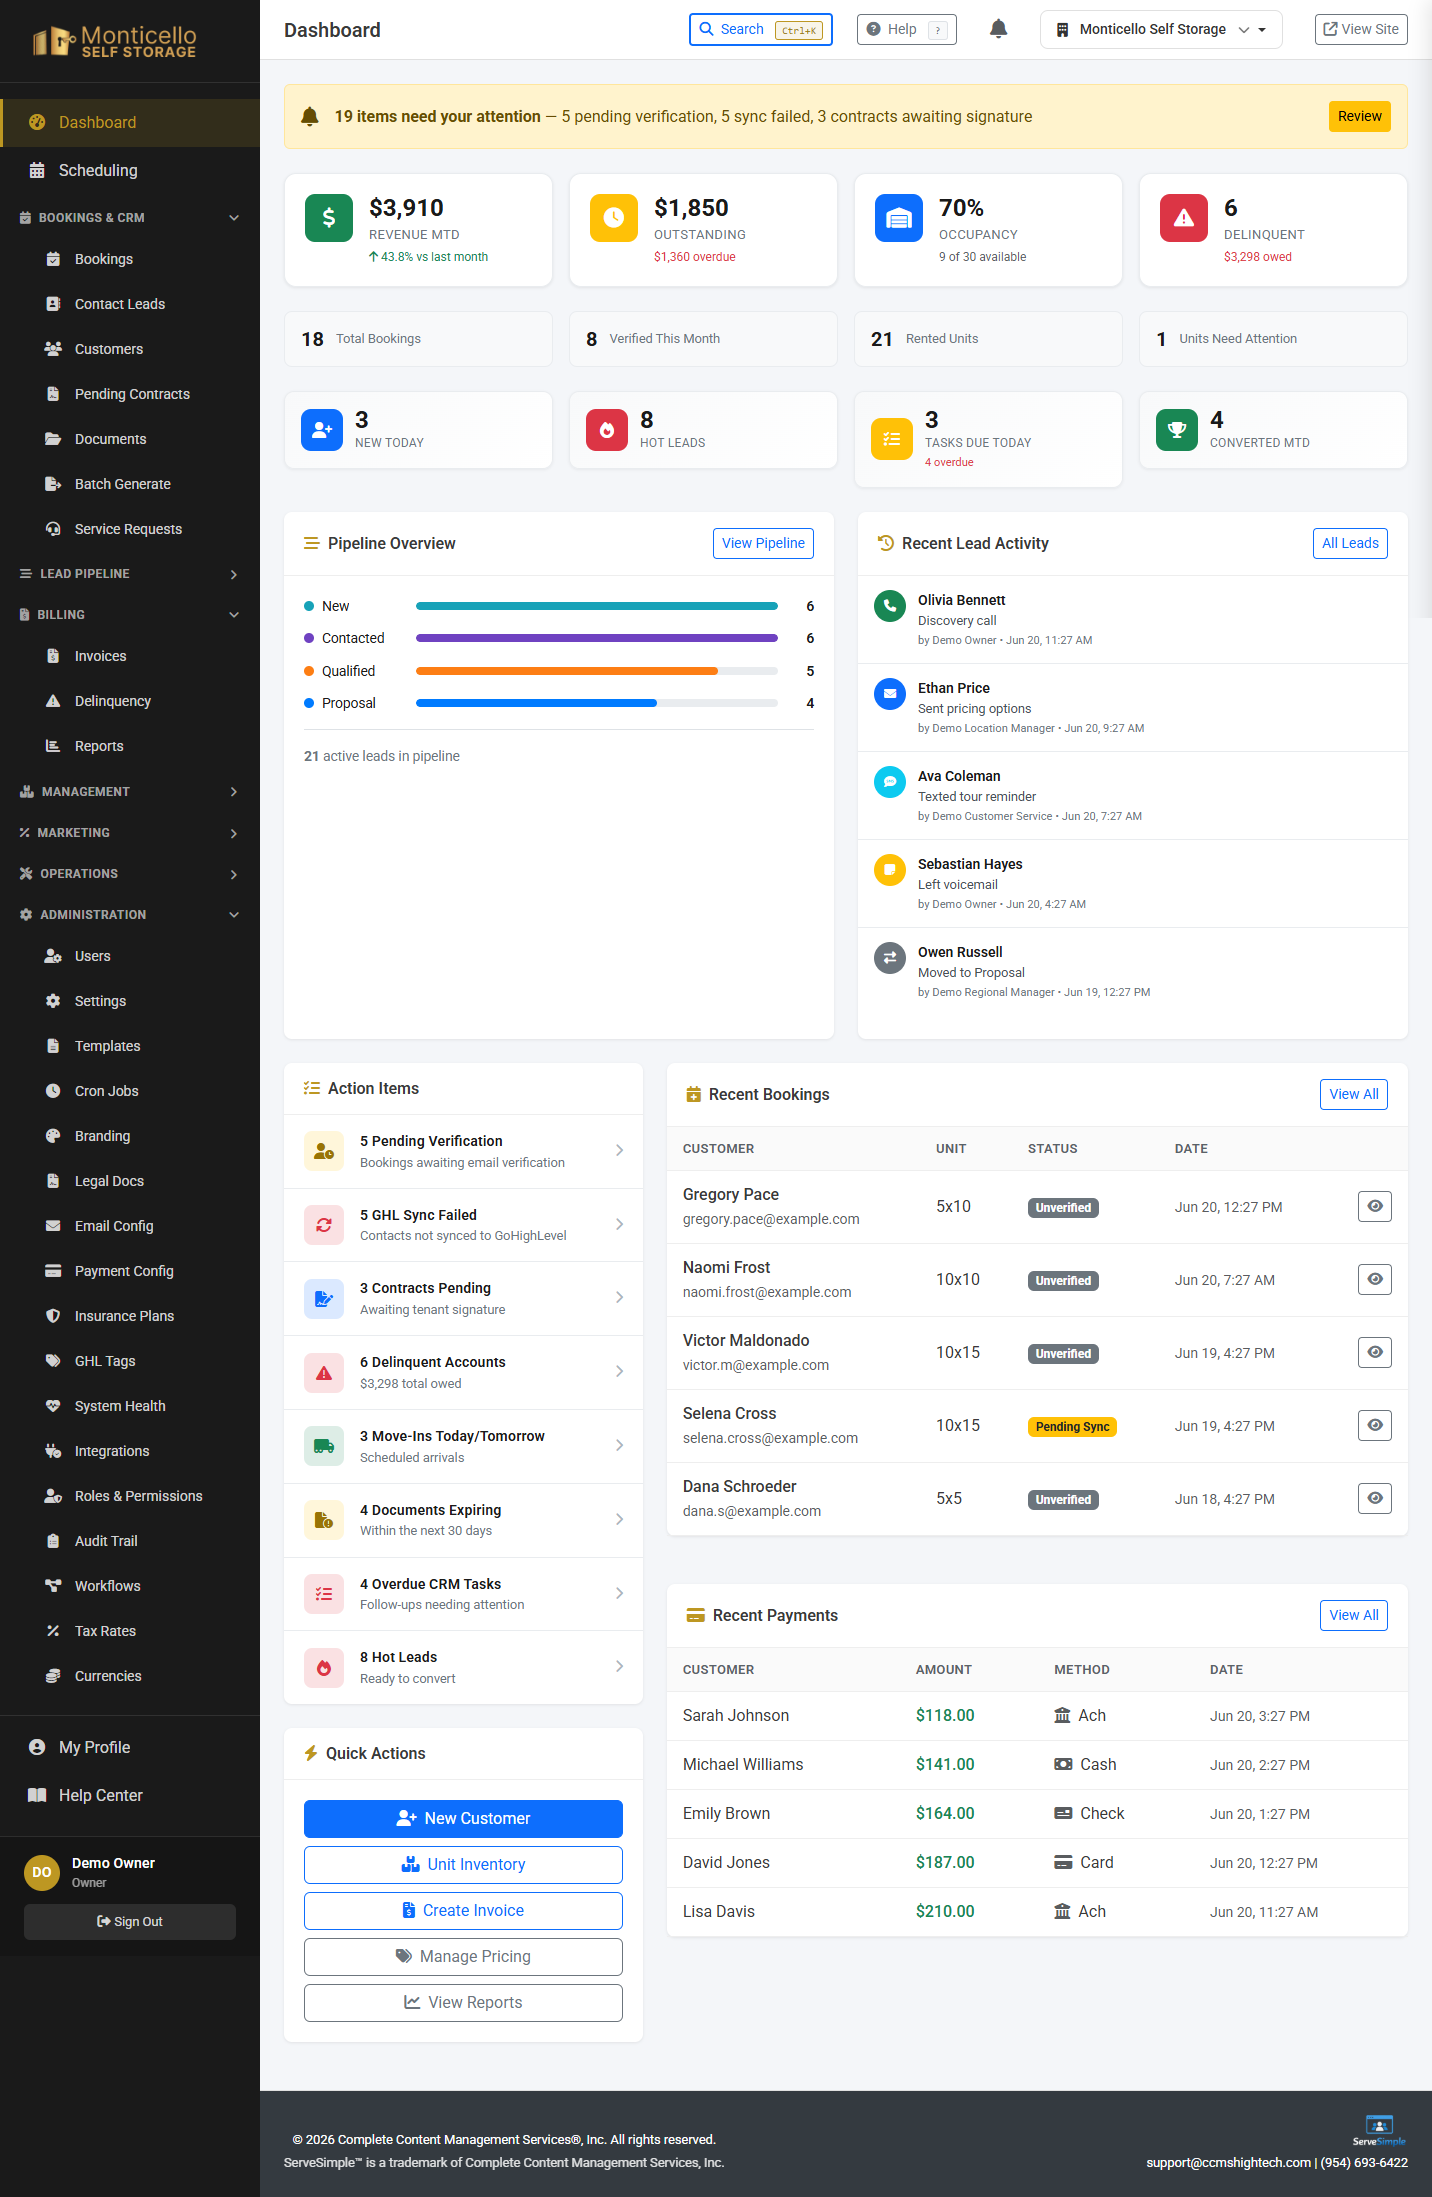
The live KPI dashboard — click to view full size
Key Performance Indicators
The metrics that matter most for self-storage operations.
Occupancy Rate
Percentage of rentable units occupied. Track by unit type or size.
Revenue Per Unit
Average revenue per occupied unit. Benchmark for pricing decisions.
Collection Rate
Percentage of billed revenue collected. Indicator of payment health.
Net Operating Income
Revenue minus operating expenses. Key profitability metric.
Move-In/Out Ratio
Track tenant turnover and net unit gain/loss.
Average Length of Stay
How long tenants stay on average. Longer is better.
Autopay Enrollment
Percentage of tenants on automatic payments.
Delinquency Rate
Percentage of tenants past due. Lower is better.
Visual Reports
Data visualization for quick understanding:
- Occupancy Trends: Line charts showing occupancy over time
- Revenue Breakdown: Pie charts by unit type or revenue source
- Collection Aging: Bar charts showing past-due buckets
- Move-In Sources: Track where tenants come from
- Unit Mix Analysis: Size distribution and performance
System Health Monitoring
Keep your operation running smoothly:
- Cron Job Dashboard: Monitor scheduled tasks and background jobs
- Integration Status: PTI, payment gateway, SMS connectivity
- Error Tracking: Failed payments, sync issues, alerts
- Performance Metrics: System response times and reliability
Custom Dashboards
Build dashboards tailored to your role:
- Drag-and-drop widget arrangement
- Choose which KPIs to display
- Set date ranges and filters
- Save multiple dashboard configurations
- Share dashboards with team members
Scheduled Reports
Get insights delivered automatically:
- Daily, weekly, or monthly email reports
- Choose report types and recipients
- PDF or Excel attachments
- End-of-month summaries
- Performance alerts and notifications
Ready for Data-Driven Decisions?
See analytics and dashboards in action.